Net Costs of Legal Immigration
to the U.S. Taxpayer
Unsustainable 1.5 Million Annual Legal-Immigrant Influx
Costs U.S. Taxpayers $330 Billion per Year
Federal Deficit Faces a $3.3 Trillion Net Hit in Next Decade,
Without a Reduction in the 1.5 Million Annual Legal-Immigrant Inflow
More than 5.9 Million Native-Born American Workers Displaced Since 2005
Had Annual Legal-Immigrant Influx Been Cut to 150,000 per Year Since 2005
Net Costs to U.S. Taxpayers Would Be $150 Billion per Year at Present
U.S. Economic and Fiscal Realities Do Not Support Current Legal Immigration Influx. In the last half century, the economic structure and finances of the United States have evolved to a point where they cannot soundly support a regular, net-positive inflow of legal immigration, let alone illegal immigration. Costs of this circumstance have included a broad loss of prosperity and employment stability for much of the U.S. population, and unstable fiscal prospects for the U.S. government.
Technological and economic developments have slowed the demand for domestic U.S. labor significantly. Structural changes to domestic labor conditions encompass factors ranging from the rapidly evolving automation of industrial and commercial activity, to the offshoring of domestic labor needs and the shifting of domestic production capacity offshore, as reflected in a record U.S. trade deficit.
Since the 2005 onset of economic slowing in the early stages of the Great Recession, these combined factors have led to the displacement of 5.9 million native-born employees by legal immigrants, again, with a multifaceted hit to domestic finances and political conditions. As early as 2003, Professor Andrew Sum estimated that all new jobs were being taken by immigrants.
This deteriorating circumstance, reflected in native-born discomfort with employment opportunities and the diminution of growth in real disposable personal income, underlay the economic disgruntlement evident amongst the electorate in the 2016 U.S. presidential election, which has not been addressed.
The deleterious effect of increasingly net-positive legal immigration on domestic labor conditions and the federal deficit pre-date 2005, but hard estimates of costs are limited by data availability and quality of same. Current circumstances are worsened seriously by the impact of illegal immigration, which fundamentally is matter of law enforcement. Hard estimates of systemic costs are limited particularly by the lack of reliable data on the true number of illegal aliens in the United States.
Net federal fiscal costs of U.S. immigration policies are estimated here from three perspectives, current policy, which allows for an annual influx of approximately 1.5 million legal immigrants, and for two alternative approaches. One approach would cut the current inflow to about 550,000 per year, and the other would cut the current inflow to about 150,000 per year. That last option is estimated to be the level of aggregate immigration that would keep the net level of annual immigration unchanged, more commonly referred to as a net-zero moratorium.
The approach to estimating the relative fiscal cost differentials, as well as the relative impact on circumstances for the native-born employed, for the three scenarios was to look at the net impact of restating history, as though each policy had been put into full effect as of January 1, 2005. Comparing and contrasting the implied annual costs that would be in place today, based on each alternative, provides some perspective as to what could lie ahead in cost differentials versus existing policy, given the two alternative approaches. The discussion and analysis review the impact (employment and fiscal cost) of displaced native-born American workers and then the direct net fiscal cost of legal, foreign-born U.S. residents.
|
|
|
|
|
|
|
|
Alternative Annual Legal Immigration Condition as of 2005 |
|||||||
(All numbers are approximate) |
|||||||
|
|
||||||
|
Category of Cost |
Existing System |
Reduction |
Reduction |
|
||
|
No Reduction |
to 550K |
to 150K |
|
|||
|
1,500K (1.5 Million) |
Net-400K* |
Net-Zero* |
|
|||
|
Net-1,350K* |
|
|||||
|
|
||||||
|
Displaced-Worker Costs |
$142 Billion |
$79 Billion |
$0 Billion |
|
||
|
Immigrant Costs |
$191 Billion |
$170 Billion |
$149 Billion |
|
||
|
|
||||||
|
Total Annual Cost in 2017 |
$333 Billion |
$249 Billion |
$149 Billion |
|
||
|
|||||||
|
Native-Born American Workers |
|
|||||
|
Displaced Since 2005 |
5.9 Million |
3.3 Million |
0 Million |
|
||
*Net immigration data assume that 150,000 persons (citizens and legal residents) voluntarily leave the U.S. annually.
Displacement of Native-Born American Workers
Immigration Influx in Conjunction with the Great Recession Onset Led to Permanent Displacement of Native-Born Employed. Examined closely, the headline U.S. employment and population statistics show what has become the permanent displacement of roughly 5.9 million native-born American workers, in a continuing circumstance. First, some of the underlying supporting detail and related complications in same are explored.
All population numbers used here are “best estimates,” reflecting the nature and unreliability of the U.S. Government data, particularly those from the U.S. Census Bureau (Census) and Department of Labor’s Bureau of Labor Statistics (BLS), along with assessments of same. Some of the issues are definitional; some simply are survey-related.
Consider the Census Surveys, which delineate population characteristics by “Native Born” versus “Foreign Born.” Census does not ask foreign-born survey participants if they are residing in the United States legally or illegally. Accordingly, the Census Bureau considers the survey detail to cover both legal and illegal immigrants, but with no estimation of the breakout. From a practical standpoint, however, those in the country illegally would tend to avoid such surveys and related official government direct contact, if at all possible. Accordingly, we count the headline aggregate “foreign born” workers in the Census data as legal immigrants for purposes of this analysis.
A Problem with Annual Comparisons in the Population and Employment Estimates. The Bureau of Labor Statistics publishes its monthly Household Survey of employment and unemployment data, based on the Current Population Survey (CPS) conducted by Census. BLS “Table A-7. Employment status of the civilian population by nativity and sex, not seasonally adjusted ...” includes monthly estimates of “Foreign Born” versus “Native Born” population, including “Employed” and “Unemployed,” which together constitute the “Labor Force.”
The headline data are not seasonally adjusted, which means that month-to-month comparisons usually are not meaningful (they are not published on that basis), in that they would reflect regular variations in seasonal conditions that often would outweigh actual underlying changes in economic activity. Usually, that circumstance allows for year-to-year comparisons of unadjusted data, such as year-to-year percent change, which would give an indication of shifting patterns of change on an annual basis. That does not work either, though, where the unadjusted BLS numbers are not comparable on a year-over-year basis.
While the related hard employment and population details are not comparable year-to-year, they are at least internally consistent for each given month. That means that derived data such as the ratio of employment-to-population, a broad measure of the health of employment activity, is meaningful and is comparable year-to-year. So, the August 2017 payroll-employment ratio among the native-born did show a minimal improvement to 59.4%, versus 59.3% the year before, while among the foreign-born, much stronger ratios improved to 63.7% in August 2017, from 62.6% from the year before.
Contrary to Apparent Headline Data, Foreign-Born Population Is Increasing, Not Decreasing, Year-to-Year. One problem with the BLS publication of the headline monthly population and employment data is that it makes annual revisions each January (published in February) to the related, prior-year’s U.S. population count (all the hard employment and unemployment counts feed off the population estimate). The BLS announces the effects of the revisions to the relative December-to-January changes, but it does not revise the headline historical data.
For example, published in February 2017, the “2017 population control effect” reduced the relative December 2016 to January 2017 population level by 831,000 (-831,000) to what was a headline decline of 660,000 (-660,000) from what in reality was a gain of 171,000, reported on a consistent basis. The historical numbers found in the BLS database reflect only the initial headline detail, not the monthly changes “corrected” for this annual and irregularly-volatile adjustment.
Using the BLS numbers we have reworked the historical BLS foreign-born and native-born data estimates on a consistent basis for this study back in time, with imputed numbers back into 2005 (monthly detail is available only to 2007), as discussed shortly. Consider, though, adjusted for the “population control effect,” the headline year-to-year change in the foreign-born, civilian noninstitutional population rose to 41.630 million in August 2017 versus 41.488 million in August 2016 (up by 0.3%, year-to-year), instead of declining to 41.630 million in August 2017 versus 41.768 million in August 2016 (down by 0.3%, year-to-year).
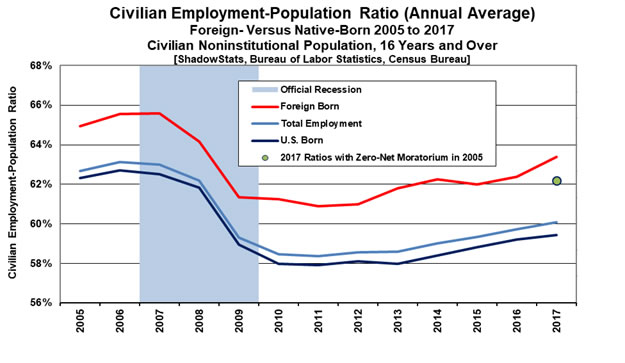
Post-Great Recession U.S. Has Not Regained Its Normal Employment Ratio.Reflected in Graph 1, the light-blue line shows the annual-average ratio of the U.S. employment to the U.S. civilian, noninstitutional population (excludes the military and those in institutions). Since the 2002 recession, that ratio had held in the 63% range. While the ratio usually declines with employment in downturns, it also usually recovers as employment gains with purported rising economic activity.
As indicated by descriptors such as “a jobless recovery,” a recovery that has not happened as expected, since the Great Recession purportedly hit bottom in 2009, with the economy in continual recovery/expansion since. Suggested by the differences between the component “U.S. Born” dark-blue line and the “Foreign Born” red line, part of that “non-recovery” likely has been due to the relative expansion of the foreign-born employed.
In an effort to quantify the potential effect, we looked to restate history for the impact of the increased foreign-born employed. Starting in 2005, which is far back as we have been able to estimate consistent data, we restated subsequent net immigration so that it was a neutral “net zero” going forward, although the effects clearly pre-dated 2005. Using the 2005 starting point, the impact of holding the annual gain in foreign-born employed unchanged, indicated that the original headline numbers reflected and encompassed a net displacement in the ensuing periods of 5.9 million native-born employed by an equivalent gain in the foreign-born employed.
With the difference in the lowered level of legal-immigrant employed, and the related pick up of same in the level of native-born employed, the total employment-population ratio for 2017 (2017 annual average imputed from headline monthly detail) for all employed is above 62% (all three lines converge at the circle in Graph 1 in this alternative scenario). That scenario is much closer to what would be suggested for aggregate employment for the headline economy in its purported state of recovery.
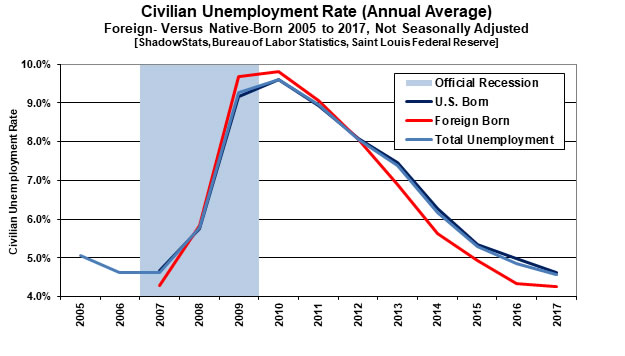
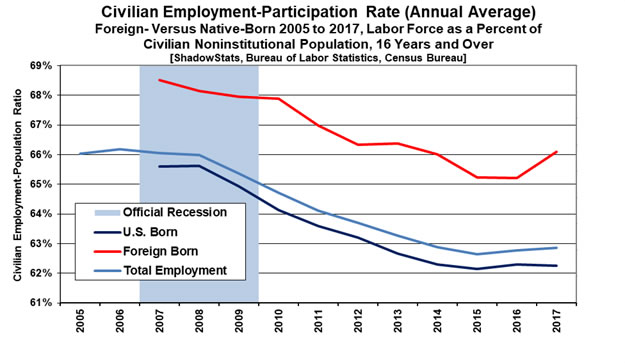
Shown in Graphs 2 and 3 on the headline unemployment rate, and the participation rate (the ratio of the labor force to population) also have shown relatively favorable shifts in employment conditions for the foreign-born employed. Of these series, only the employment-population ratio is not distorted by unemployment that has been defined to be artificially narrow. Defining employment here is straight forward, while defining unemployment becomes complex very quickly. For example, if an individual is unemployed, but has not looked for work in the last four weeks, that individual is not counted in the headline labor force. Instead, the unemployed individual is classified as a discouraged worker for one year, before being dropped from formal accounting.
Generally, displaced workers end up in that process. The uncounted long-term displaced workers can end up in areas ranging from babysitting grandchildren, so that a son or daughter can work, to entering the rolls of “disabled” workers, which swelled during the Great Recession.
Where the Bureau of Labor Statistics does not account adequately for the long-term discouraged or displaced worker in its surveying, it does estimate the number of people wanting a job each month (including formally “discouraged” workers and those marginally attached to the labor force, but none counted as “unemployed”), which some have described as including all displaced workers. Coincidentally, the total number of people wanting a job in August 2017 was 5.9 million, the same level as shown as displaced by foreign-born employed in our analysis. There are many factors at work here, and the headline detail of the BLS is definitionally light in defining the depths of the unemployment difficulties.
Graph 1: Civilian Employment-Population Ratio (Annual Average)
Fiscal costs of the displaced workers here, ranging from reduced income tax payments and payroll tax contributions, to costs tied to early-retirements and increased disability claims, etc. are meaningful, approximately $142 billion, as reflected in the “Existing System” column of the summary table.
Graph 2: Civilian Unemployment Rate (Annual Average)
Graph 3: Civilian Employment-Participation Rate (Annual Average)
Direct U.S. Government Fiscal Costs of Legal, Foreign-Born U.S. Residents
Existing System Shows Annual Net Fiscal Costs of $191 Billion on Top of $142 Billion Displacement Costs. Again, the net annual federal fiscal costs of U.S. immigration policies are estimated here from three perspectives, current policy, which allows for an annual influx of approximately 1.5 million legal immigrants, and for two alternative approaches, the first, which would cut the current immigration inflow to about 550,000, per year, and the second, which would cut the current inflow to about 150,000 per year.
The approach to estimating the relative fiscal costs for the three scenarios was to look at the net impact of restating history, as though each policy had been put into full effect as of January 1, 2005. Comparing and contrasting the implied annual costs that would be in place today, based on each alternative, provides perspective as to what could lie ahead in fiscal cost differentials for existing policy, versus the two alternative approaches.
Estimated Average 2017 Legal Immigrant Population at 44.6 Million. The basis for the comparative fiscal numbers by scenario is an estimated annual-average foreign-born U.S. population of 44.6 million in 2017, reflecting existing net annual immigration in place of 1.35 million. Such is against 39.8 million in 2017 that would have resulted from net annual immigration of 400,000, and versus 35.7 million in 2017 based on net-zero immigration having been in place.
The population estimates encompass numbers from the Census Bureau’s American Community Survey (ACS), adjusted for and in the context of population estimates from the Census Bureau’s Current Population Survey (CPS), which is more current in its detail, through September 2017. Where the CPS numbers are used in the monthly employment reporting by the BLS, discussed earlier, those details have been readjusted and smoothed for headline discontinuities. The annual numbers used are averages, with the 2017 estimate imputed from nine months of data. The CPS reflects only the smaller, civilian, noninstitutional population, 16 years and older, which is used by the BLS as the universe that includes employed individuals. The CPS numbers used in the imputations, however, are adjusted for differences with the aggregate population.
Annual fiscal costs largely were assessed proportionate to the alternative-scenario population estimates, against immigrant-related, specific fiscal components tied to U.S. government outlays.
Net of the federal taxes paid by legal immigrants, and the costs of displaced native-born workers discussed earlier, the proportionate federal outlays attributable to legal immigration broke out among the federal agencies/departments as follows: Health and Human Services (62.6%), largely health insurance and welfare; Education (13.9%), primarily K-12, student loans are viewed as assets; Justice (13.5%), primarily federal prisons; Homeland Security (4.5%); Labor (3.2%); Housing and Urban Development (2.3%).
The underlying fiscal summaries were based on the Financial Report of the United States Government (2016), the government’s GAAP-based (Generally Accepted Accounting Principles) financial statements, published by the Government Accountability Office (GAO). The 2017 estimates were imputed from the 2016 fiscal details and are in current 2017 dollars.
Summarized in the opening table, total net annual costs for 2017 are estimated at $333 billion (including $142 billion displacement cost) for the existing system (1.35 million net immigration); $249 billion (including $79 displacement cost) for 400,000 net immigration; $149 billion (including no displacement cost) for net-zero immigration.
Carrying Capacity Network commissioned economist John Williams of Shadow Government Statistics to study the net fiscal costs of current U.S. immigration policies, which allow for an annual inflow of approximately 1.5 million legal immigrants. Results of that research follow. Media should contact ccn-coststudy@att.net for further information and interviews.
Sum, Andrew, Harrington, Paul, Palma, Sheila. The Impacts of the Recession of 2001 and the Jobless Recovery of 2002 on the Native Born and Immigrant Workforce of the United States. Northeastern University (Boston) and Center for Immigration Studies (Washington, D.C.). February, 2003.
- Sum, Andrew et al. "Foreign Immigration and the Labor Force of the United States." Center for Labor Market Studies, Northeastern University, July, 2004.
- See also: https://repository.library.northeastern.edu/files/neu:376355
To help CCN distribute and publicize this Study, please send Donations (tax deductible) ASAP payable to:
Carrying Capacity Network
P. O. Box 457
San Francisco, California
94104
or make a secure Donation on this website.
Sincerely,
Carrying Capacity Network
www.carryingcapacity.org
www. carryingcapacitynetworkorg. blogspot.com
Twitter: @CCNetworkOrg